Architecture overview
This online documentation is associated with pre-print ‘OPETH: Open Source Solution for Real-time Peri-event Time Histogram Based on Open Ephys’ by András Széll, Sergio Martínez-Bellver, Panna Hegedüs and Balázs Hangya. DOI: https://doi.org/10.1101/783688.
Data acquisition: Open Ephys ZMQ plugin
Data acquisition and signal conditioning is performed by Open Ephys. OPETH implements spike thresholding itself, therefore a Spike Detector plug-in should not be included before the ZMQ interface. OPETH receives data from OE’s ZeroMQ interface plugin. The plugin broadcasts recorded data and events that can be subscribed to by external applications. Timestamps accompanying these data and event packets are the sample index, which will get converted to actual timestamp based on current sampling rate.
The ZMQ Interface plugin opens a ZMQ publisher socket to allow one or more ZMQ clients to subscribe (connect) locally or over the network. Though the system is typically used with a single client connected locally, it is possible to use multiple OPETH clients on one or more PCs analyzing the same Open Ephys data source simultaneously with different settings.
The ZMQ plugin uses JSON format data packets for the digitized data and event metadata (e.g. timestamp, event channel, number of data channels and sample count). Another socket for event messages and responses is used for heartbeat messages to notify the plugin about the connected clients. (Possibly for listing them on ZMQ plugin interface.)
Open Ephys - OPETH interface
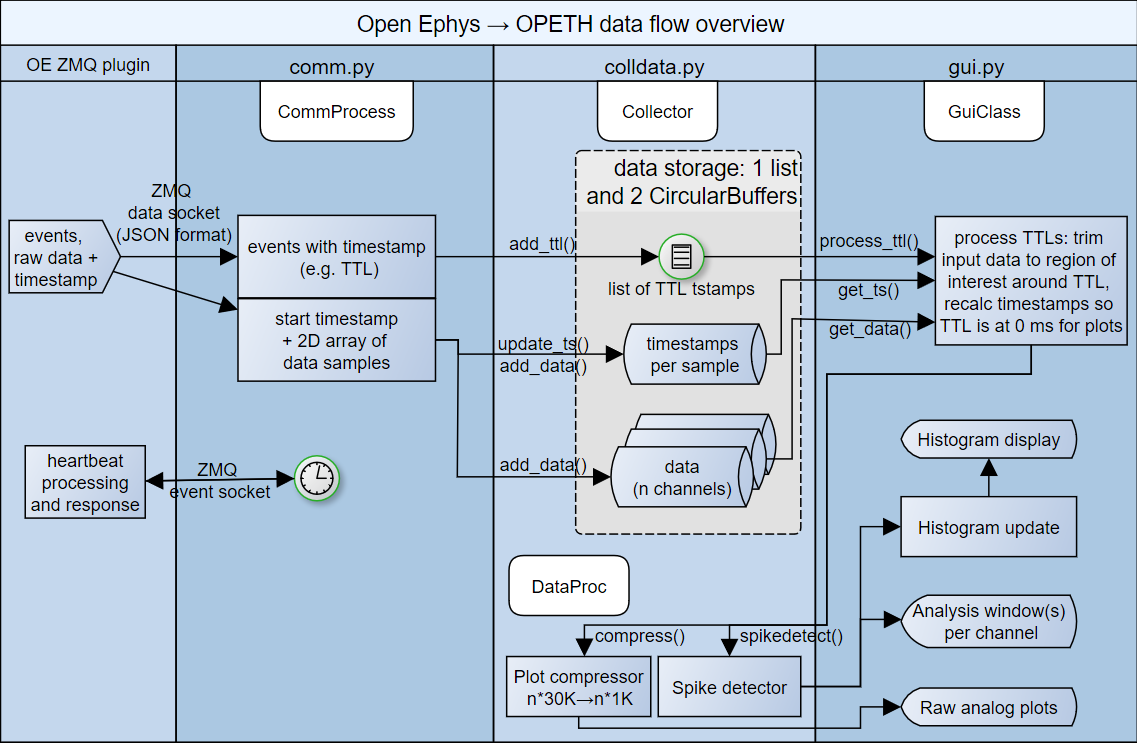
Input data arriving from Open Ephys is handled by opeth.comm, which
takes care of parsing the JSON structures containing the measurement samples
and trigger events. Depending on the type of the parsed input data, trigger
events are stored in OpenEphysEvent objects (defined in openephys.py) and
sample data are stored directly in a 2D circular (or rolling) buffer
implemented in opeth.circbuff; the data flow is managed by the
opeth.colldata.Collector class in opeth.colldata.py.
(The opeth.openephys and some of the opeth.comm interface
routines are based on the python samples created by Francesco Battaglia.)
The following figure summarizes the main data flow of OPETH:
OPETH GUI overview
Display windows currently available:
- Main histogram / parameter setup
- Raw analog data debug
- Spike analysis window (opened by the Open new spike win button)
At startup, two windows are opened by default: the main histogram window displaying the online PETH results, and a raw analog data plot for debugging. The spike analysis window is a third view that makes it possible to visually differentiate between spikes and artefacts.
Histogram window
The main GUI window is implemented in opeth.gui, which schedules data
reading, spike discrimination, performs histogram calculation and enables the
adjustment of parameter setup.
Raw analog data window
In the interest of CPU time, the plot is updated at a low frame rate and the
data displayed are downsampled to 1000 Hz for this view.
Instead of relying on pyqtgraph’s downsampling capabilities a different one
was used. The raw debug display was implemented in opeth.gui.GuiClass.update(), with min-maxed
data downsampling in opeth.colldata.DataProc.compress().
Spike analysis window
Spike windows opened from the main histogram window and are handled by
opeth.spike_gui.
Multiple Spike windows can be displayed simultaneously, but this is CPU
intensive.
Logging
Log files are created automatically.
Configuration
Last used configuration file name is stored in the file lastini.conf.
Configurations are stored in the ini file format, and parsed by the
configparser module.