Using OPETH
This online documentation is associated with pre-print ‘OPETH: Open Source Solution for Real-time Peri-event Time Histogram Based on Open Ephys’ by András Széll, Sergio Martínez-Bellver, Panna Hegedüs and Balázs Hangya. DOI: https://doi.org/10.1101/783688.
OPETH was tested under Windows only. Feedback is welcomed for other platforms.
Connecting OPETH to Open Ephys
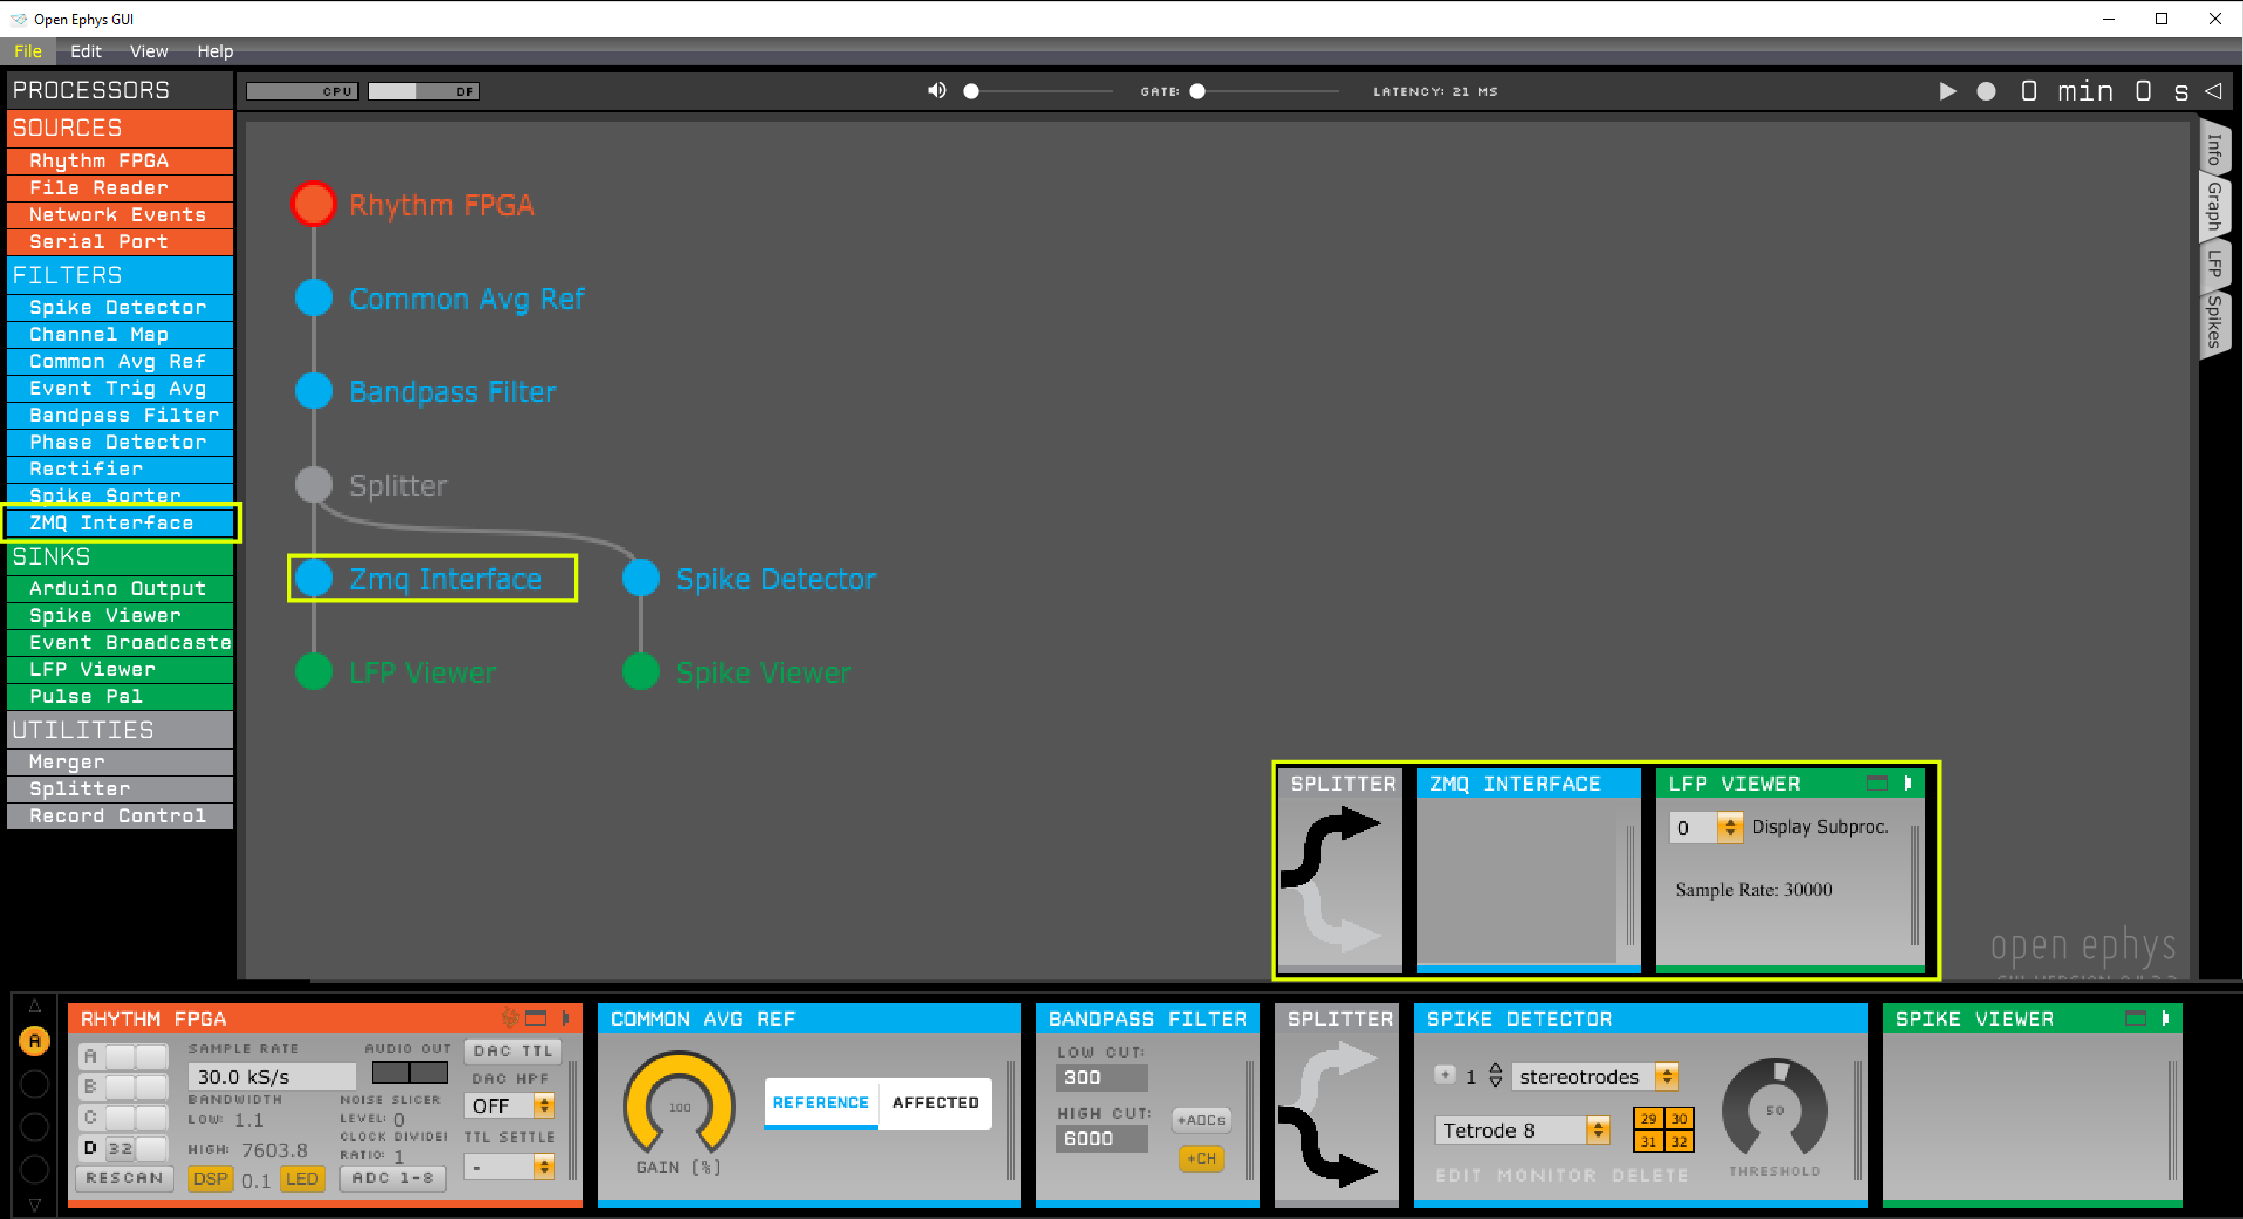
OPETH relies on data and events recorded and timestamped by Open Ephys. These data are broadcasted by Open Ephys through the ZMQ Interface plugin.
- Signal conditioning/filtering should be performed by Open Ephys, therefore the ZMQ plugin should be placed after appropriate filters. E.g. Band-pass filtering between 600-6000 Hz enables threshold-based action potential detection.
- Spikes are detected by OPETH, so a spike filter plugin in OE is unnecessary for OPETH.
Sample OE signal chain for ZMQ broadcasting:

OPETH connects to the local data and event ports of the ZMQ plugin. It is possible to run multiple OPETH instances with different settings simultaneously. (Connecting over the network could also be possible but not implemented in the GUI currently.)
It is recommended to have Open Ephys set up and started before running OPETH.
OPETH graphical interface
The GUI consists of three different type of windows currently:
- Main histogram window: The main window displays histograms, parameters and buttons for handling the configuration and the different plots.
- Raw analog data window: real time data view displays data arriving from Open Ephys, used for debugging (e.g. to determine whether spikes are absent due to triggering issues or because of data content).
- Spike analysis windows: Opened from main window. Displays detected spikes for a single channel for visual spike/artefact observations.
Online Peri-event Time Histogram (main window)
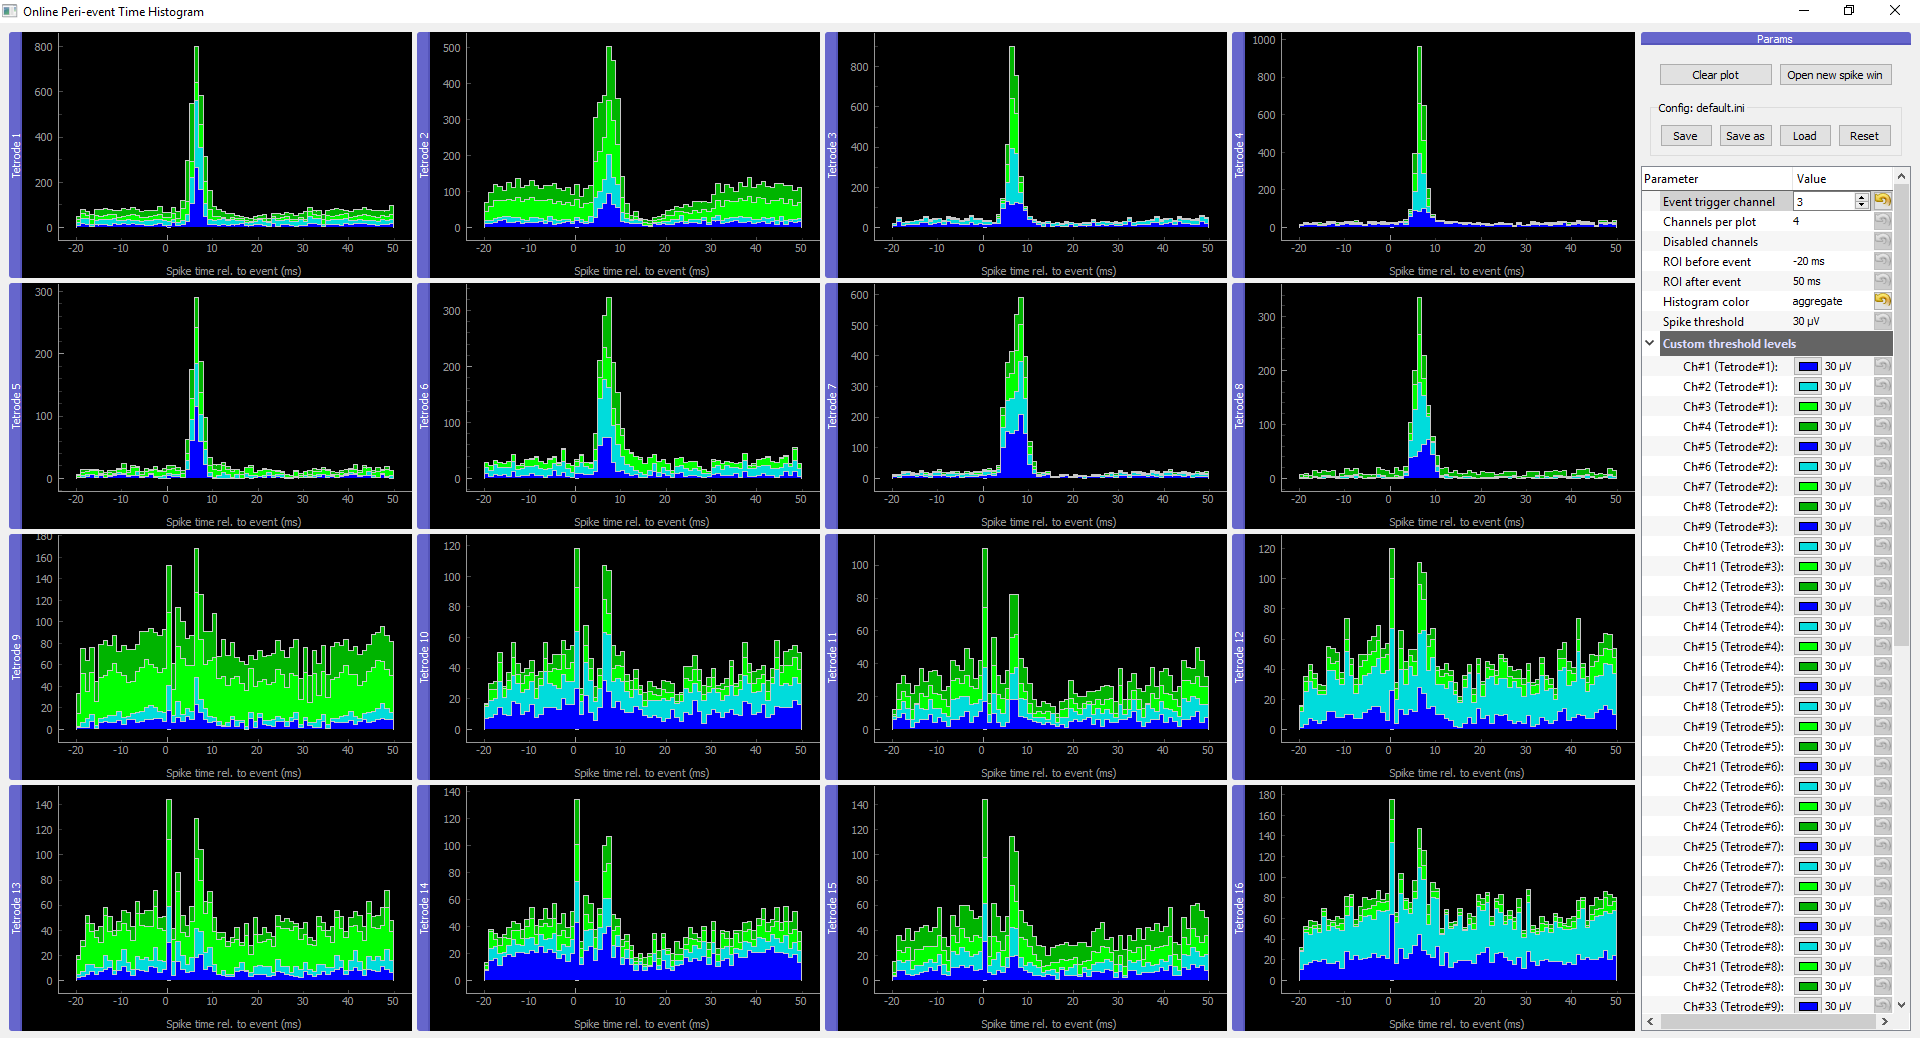
A view of an actual recording session performed with OPETH with PETHs on the left side and UI buttons/params on the right:

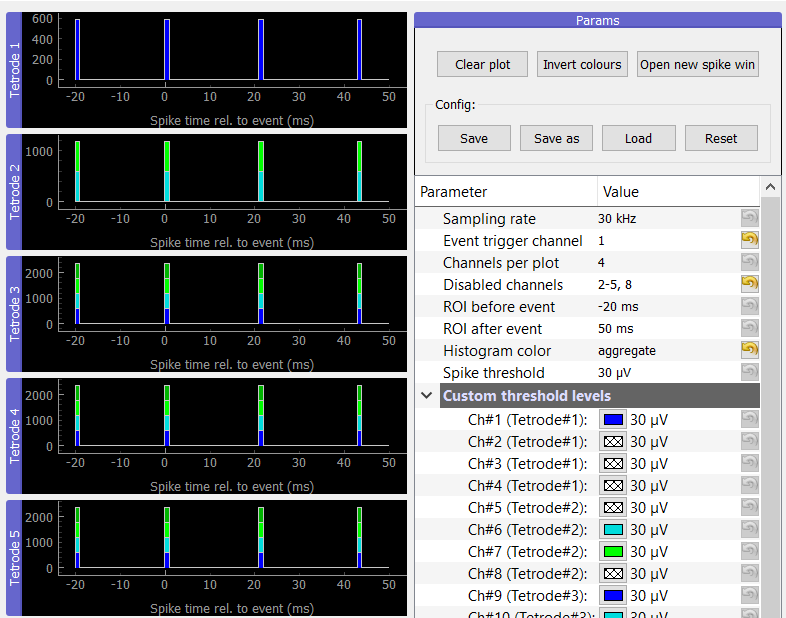
Synthetic data and parameters close-up with tetrode #1 displaying channel 1, tetrode #2 displaying ch 6 and 7 only:

The histograms are pyqtgraph elements so by dragging their title they can be rearranged or by double clicking even detached from the main window.
Parameter description:
Sampling rate: should match Open Ephys Rhythm FPGA settings. (Will be read-only after fixing a bug preventing accessing this info.)
Event trigger channel: the OE trigger channel. Can be a TTL pulse source e.g. PulsePal or BPOD event triggers. (Technically non-TTL signals can also be reported by OE as timestamped event.)
Channels per plot: channels are collected in groups of four by default as for classical tetrode recordings, but can be set from 1 to 8 (for single electrodes, stereotrodes etc.) Changing it automatically changes the number of histograms displayed.
Disabled channels: disable channels that are not to be spike-filtered, e.g. noisy or inactive channels. See screenshot for accepted formats. OPETH automatically disables and hides the extra 3 gyroscope channels of a 32 or 64 channel setup if 35/70 channels are detected (if not desired, change behaviour with
opeth.gui.HIDE_AUX_CHANNELS).ROI before/after event: region of interest around trigger. Only this part of the analog data is spike filtered.
Histogram color:
- flat histogram merges spikes from all channels of the given tetrode
- aggregate (default) view displays channels in distinct colors but in the same histogram bin,
- channels display a line plot for each channel separately.
Spike threshold: threshold level can be applied globally or per channel. By default negative spikes are detected and the threshold levels in GUI are considered absolute value.
If multiple triggers fall within the ROI, the same spikes may be detected for the triggers in the overlapping part.
Plot handling buttons:
- Clear plot: clears histogram windows.
- Invert colours: switch between black and white background for histogram plots. (Experimental.)
- Open new spike win: initiate new spike analysis window.
Parameters can be saved and loaded into ini files, last used file is remembered and reloaded upon startup.
Configuration handling buttons:
- Save/Save as: store current configuration into file.
- Load: open a different configuration when changing to a different experimental project.
- Reset: restore defaults.
Raw data window
Displays data received directly from Open Ephys, allowing low-level visualization of input for debugging.
- Channels are auto-scaled and do not provide information on actual voltage levels yet.
- The top half of the window is a rolling display that plots all channels simultaneously. To zoom in, hold right mouse button and move the mouse.
- The plot is updated at a low frame rate and the data displayed are downsampled to 1000 Hz.
- The bottom part has a stimulus counter and presents analog data aligned to the trigger stimuli.
- Window boundaries with respect to the trigger are set by the ROI before event and ROI after event parameters.
- Can be closed if not required for debugging.
When the stimulus counter is not incrementing, no triggers are received and thus no spike detection will be performed (-> histograms not updated).
Spike analysis window
Spike windows are opened pressing the Open new spike win button. By opening multiple spike windows it is possible to compare channels side by side, but too many open windows will result in poor performance.

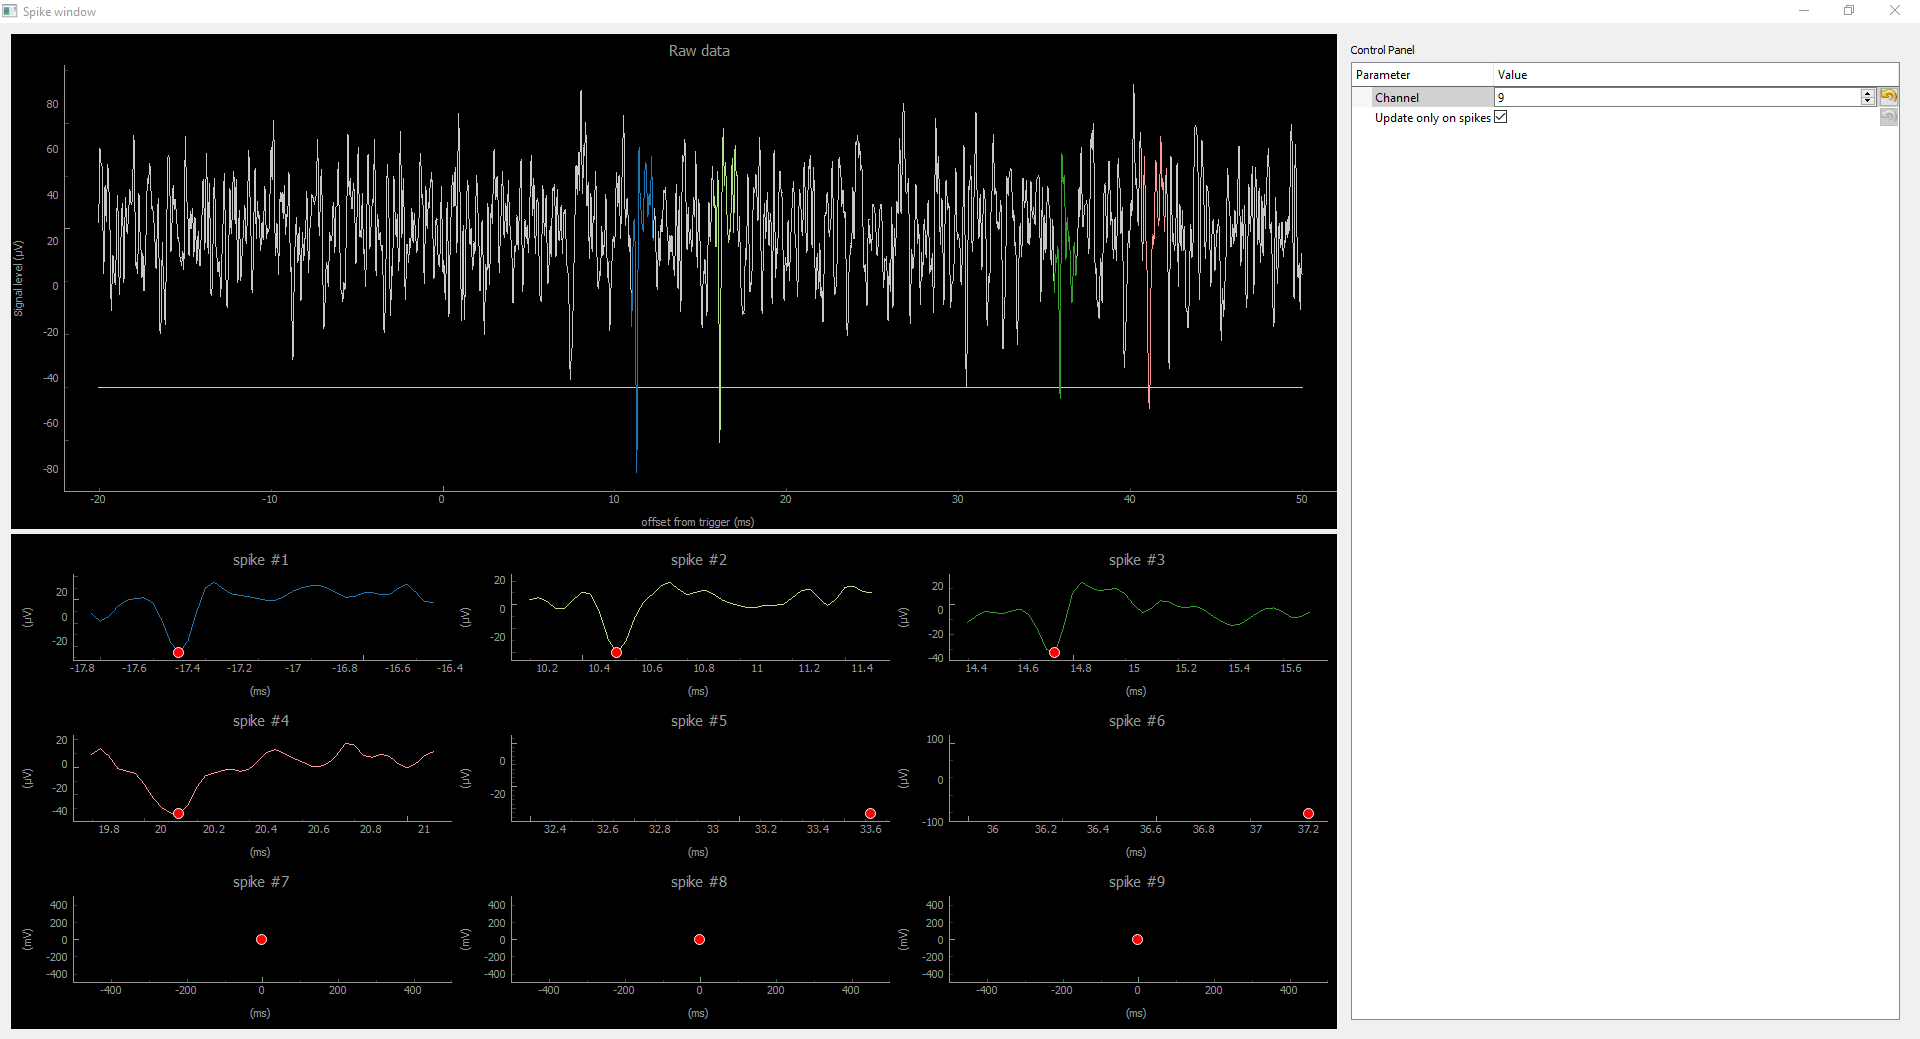
The window consists of two plot parts: the top part shows the raw input around the event, and the bottom part displays the detected spikes within the ROI of the event. The spike position is marked with a red dot in the bottom plots. These spikes are overlaid in the top plot in color and make it easy to differentiate valid spikes from false positives. It is possible to zoom in/out holding down the right mouse button in the spike windows.
Each spike window displays data for a single channel. The channel number can be adjusted real-time.
If the Update only on spike option is selected, spike windows are updated when new spikes are detected within the ROI of the trigger; otherwise, spike windows are updated 5 times per second even when no spikes are present.
Spike detection
OPETH performs simple spike detection with threshold crossing detection. No spike sorting or artefact removal is performed.